
- Introduction
- Frequently Asked Questions:
- What is the greenhouse effect, and is it affecting our climate?
- Are greenhouse gases increasing?
- Is the climate warming?
- Are El Niños related to Global Warming?
- Is the hydrological cycle (evaporation and precipitation) changing?
- Is the atmospheric/oceanic circulation changing?
- Is the climate becoming more variable or extreme?
- How important are these changes in a longer-term context?
- Is sea level rising?
- Can the observed changes be explained by natural variability, including changes in solar output?
- What about the future?
This page is based on a brief synopsis of the 2007 Fourth Assessment Report (AR4) by the Intergovernmental Panel on Climate Change (IPCC), as well as NCDC's own data resources. It was prepared by David Easterling and Tom Karl, National Climatic Data Center, Asheville, N.C. 28801.
 Introduction
One of the most vigorously debated topics on Earth is the issue of climate change, and the National Environmental Satellite, Data, and Information Service (NESDIS) data centers are central to answering some of the most pressing global change questions that remain unresolved. The National Climatic Data Center contains the instrumental and paleoclimatic records that can precisely define the nature of climatic fluctuations at time scales of a century and longer. Among the diverse kinds of data platforms whose data contribute to NCDC's resources are: Ships, buoys, weather stations, weather balloons, satellites, radar and many climate proxy records such as tree rings and ice cores. The National Oceanographic Data Center contains the subsurface ocean data which reveal the ways that heat is distributed and redistributed over the planet. Knowing how these systems are changing and how they have changed in the past is crucial to understanding how they will change in the future. And, for climate information that extends from hundreds to thousands of years, paleoclimatology data, also available from the National Climatic Data Center, helps to provide longer term perspectives.
Internationally, the Intergovernmental Panel on Climate Change (IPCC), under the auspices of the United Nations (UN), World Meteorological Organization (WMO), and the United Nations Environment Program (UNEP), is the most senior and authoritative body providing scientific advice to global policy makers. The IPCC met in full session in 1990, 1995, 2001 and in 2007. They address issues such as the buildup of greenhouse gases, evidence, attribution, and prediction of climate change, impacts of climate change, and policy options.
Listed below are a number of questions commonly addressed to climate scientists, and brief replies (based on IPCC reports and other research) in common, understandable language. This list will be periodically updated, as new scientific evidence comes to light.
1. What is the greenhouse effect, and is it affecting our climate?
The greenhouse effect is unquestionably real and helps to regulate the temperature of our planet. It is essential for life on Earth and is one of Earth's natural processes. It is the result of heat absorption by certain gases in the atmosphere (called greenhouse gases because they effectively 'trap' heat in the lower atmosphere) and re-radiation downward of some of that heat. Water vapor is the most abundant greenhouse gas, followed by carbon dioxide and other trace gases. Without a natural greenhouse effect, the temperature of the Earth would be about zero degrees F (-18°C) instead of its present 57°F (14°C). So, the concern is not with the fact that we have a greenhouse effect, but whether human activities are leading to an enhancement of the greenhouse effect by the emission of greenhouse gases through fossil fuel combustion and deforestation.
2. Are greenhouse gases increasing?
Human activity has been increasing the concentration of greenhouse gases in the atmosphere (mostly carbon dioxide from combustion of coal, oil, and gas; plus a few other trace gases). There is no scientific debate on this point. Pre-industrial levels of carbon dioxide (prior to the start of the Industrial Revolution) were about 280 parts per million by volume (ppmv), and current levels are greater than 380 ppmv and increasing at a rate of 1.9 ppm yr-1 since 2000. The global concentration of CO2 in our atmosphere today far exceeds the natural range over the last 650,000 years of 180 to 300 ppmv. According to the IPCC Special Report on Emission Scenarios (SRES), by the end of the 21st century, we could expect to see carbon dioxide concentrations of anywhere from 490 to 1260 ppm (75-350% above the pre-industrial concentration).
3. Is the climate warming?
Global surface temperatures have increased about 0.74°C (plus or minus 0.18°C) since the late-19th century, and the linear trend for the past 50 years of 0.13°C (plus or minus 0.03°C) per decade is nearly twice that for the past 100 years. The warming has not been globally uniform. Some areas (including parts of the southeastern U.S. and parts of the North Atlantic) have, in fact, cooled slightly over the last century. The recent warmth has been greatest over North America and Eurasia between 40 and 70°N. Lastly, seven of the eight warmest years on record have occurred since 2001 and the 10 warmest years have all occurred since 1995.

 Recent analyses of temperature trends in the lower and mid- troposphere (between about 2,500 and 26,000 ft.) using both satellite and radiosonde (weather balloon) data show warming rates that are similar to those observed for surface air temperatures. These warming rates are consistent with their uncertainties and these analyses reconcile a discrepancy between warming rates noted on the IPCC Third Assessment Report (U.S. Climate Change Science Plan Synthesis and Assessment Report 1.1).
An enhanced greenhouse effect is expected to cause cooling in higher parts of the atmosphere because the increased "blanketing" effect in the lower atmosphere holds in more heat, allowing less to reach the upper atmosphere. Cooling of the lower stratosphere (about 49,000-79,500 ft.) since 1979 is shown by both satellite Microwave Sounding Unit and radiosonde data (see previous figure), but is larger in the radiosonde data likely due to uncorrected errors in the radiosonde data.
Relatively cool surface and tropospheric temperatures, and a relatively warmer lower stratosphere, were observed in 1992 and 1993, following the 1991 eruption of Mt. Pinatubo. The warming reappeared in 1994. A dramatic global warming, at least partly associated with the record El Niño, took place in 1998. This warming episode is reflected from the surface to the top of the troposphere.
 There has been a general, but not global, tendency toward reduced diurnal temperature range (DTR: the difference between daily high or maximum and daily low or minimum temperatures) over about 70% of the global land mass since the middle of the 20th century. However, for the period 1979-2005 the DTR shows no trend since the trend in both maximum and minimum temperatures for the same period are virtually identical; both showing a strong warming signal. A variety of factors likely contribute to this change in DTR, particularly on a regional and local basis, including changes in cloud cover, atmospheric water vapor, land use and urban effects.
 Indirect indicators of warming such as borehole temperatures, snow cover, and glacier recession data, are in substantial agreement with the more direct indicators of recent warmth. Evidence such as changes in glacial mass balance (the amount of snow and ice contained in a glacier) is useful since it not only provides qualitative support for existing meteorological data, but glaciers often exist in places too remote to support meteorological stations. The records of glacial advance and retreat often extend back further than weather station records, and glaciers are usually at much higher altitudes than weather stations, allowing scientists more insight into temperature changes higher in the atmosphere.
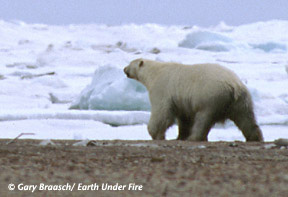
 Large-scale measurements of sea-ice have only been possible since the satellite era, but through looking at a number of different satellite estimates, it has been determined that September Arctic sea ice has decreased between 1973 and 2007 at a rate of about -10% +/- 0.3% per decade. Sea ice extent for September for 2007 was by far the lowest on record at 4.28 million square kilometers, eclipsing the previous record low sea ice extent by 23%. Sea ice in the Antarctic has shown very little trend over the same period, or even a slight increase since 1979. Though extending the Antarctic sea-ice record back in time is more difficult due to the lack of direct observations in this part of the world.
4. Are El Niños related to Global Warming?
El Niños are not caused by global warming. Clear evidence exists from a variety of sources (including archaeological studies) that El Niños have been present for thousands, and some indicators suggest maybe millions, of years. However, it has been hypothesized that warmer global sea surface temperatures can enhance the El Niño phenomenon, and it is also true that El Niños have been more frequent and intense in recent decades. Whether El Niño occurrence changes with climate change is a major research question.
5. Is the hydrological cycle (evaporation and precipitation) changing?
 Globally-averaged land-based precipitation shows a statistically insignificant upward trend with most of the increase occurring in the first half of the 20th century. Further, precipitation changes have been spatially variable over the last century. On a regional basis increases in annual precipitation have occurred in the higher latitudes of the Northern Hemisphere and southern South America and northern Australia. Decreases have occurred in the tropical region of Africa, and southern Asia. Due to the difficulty in measuring precipitation, it has been important to constrain these observations by analyzing other related variables. The measured changes in precipitation are consistent with observed changes in stream flow, lake levels, and soil moisture (where data are available and have been analyzed).

 Northern Hemisphere snow cover extent has consistently remained below average since 1987, and has decreased by about 10% since 1966. This is mostly due to a decrease in spring and summer snow extent over both the Eurasian and North American continents since the mid-1980s. Winter and autumn snow cover extent have shown no significant trend for the northern hemisphere over the same period.
Clouds are also an important indicator of climate change. Surface-based observations of cloud cover suggest increases in total cloud cover over many continental regions. This increase since 1950 is consistent with regional increases in precipitation for the same period. However, global analyses of cloud cover over land for the 1976-2003 period show little change.
6. Is the atmospheric/oceanic circulation changing?
A rather abrupt change in the El Niño - Southern Oscillation behavior occurred around 1976/77. Often called the climatic shift of 1976/77, this new regime has persisted. There have been relatively more frequent and persistent El Niño episodes rather than the cool episode La Niñas. This behavior is highly unusual in the last 130 years (the period of instrumental record). Changes in precipitation over the tropical Pacific are related to this change in the El Niño - Southern Oscillation, which has also affected the pattern and magnitude of surface temperatures. However, it is unclear as to whether this apparent change in the ENSO cycle is related to global warming.
7. Is the climate becoming more variable or extreme?
 Examination of changes in climate extremes requires long-term daily or even hourly data sets which until recently have been scarce for many parts of the globe. However these data sets have become more widely available allowing research into changes in temperature and precipitation extremes on global and regional scales. Global changes in temperature extremes include decreases in the number of unusually cold days and nights and increases in the number of unusually warm days and nights. Other observed changes include lengthening of the growing season, and decreases in the number of frost days.
Global temperature extremes have been found to exhibit no significant trend in interannual variability, but several studies suggest a significant decrease in intra-annual variability. There has been a clear trend to fewer extremely low minimum temperatures in several widely-separated areas in recent decades. Widespread significant changes in extreme high temperature events have not been observed. There is some indication of a decrease in day-to-day temperature variability in recent decades.
 In areas where a drought or excessive wetness usually accompanies an El Niño or La Niña, these dry or wet spells have been more intense in recent years. Further, there is some evidence for increasing drought worldwide, however in the U.S. there is no evidence for increasing drought.In some areas where overall precipitation has increased (ie. the mid-high northern latitudes), there is evidence of increases in the heavy and extreme precipitation events. Even in areas such as eastern Asia, it has been found that extreme precipitation events have increased despite total precipitation remaining constant or even decreasing somewhat. This is related to a decrease in the frequency of precipitation in this region.
 Many individual studies of various regions show that extra-tropical cyclone activity seems to have generally increased over the last half of the 20th century in the northern hemisphere, but decreased in the southern hemisphere. Furthermore, hurricane activity in the Atlantic has shown an increase in number since 1970 with a peak in 2005. It is not clear whether these trends are multi-decadal fluctuations or part of a longer-term trend.
8. How important are these changes in a longer-term context?
Paleoclimatic data are critical for enabling us to extend our knowledge of climatic variability beyond what is measured by modern instruments. Many natural phenomena are climate dependent (such as the growth rate of a tree for example), and as such, provide natural 'archives' of climate information. Some useful paleoclimate data can be found in sources as diverse as tree rings, ice cores, corals, lake sediments (including fossil insects and pollen data), speleothems (stalactites etc), and ocean sediments. Some of these, including ice cores and tree rings provide us also with a chronology due to the nature of how they are formed, and so high resolution climate reconstruction is possible in these cases. However, there is not a comprehensive 'network' of paleoclimate data as there is with instrumental coverage, so global climate reconstructions are often difficult to obtain. Nevertheless, combining different types of paleoclimate records enables us to gain a near-global picture of climate changes in the distant past.
 For Northern Hemisphere temperature, recent decades appear to be the warmest since at least about 1000AD, and the warming since the late 19th century is unprecedented over the last 1000 years. Older data are insufficient to provide reliable hemispheric temperature estimates. Ice core data suggest that the 20th century has been warm in many parts of the globe, but also that the significance of the warming varies geographically, when viewed in the context of climate variations of the last millennium.
Large and rapid climatic changes affecting the atmospheric and oceanic circulation and temperature, and the hydrological cycle, occurred during the last ice age and during the transition towards the present Holocene period (which began about 10,000 years ago). Based on the incomplete evidence available, the projected change of 3 to 7°F (1.5 - 4°C) over the next century would be unprecedented in comparison with the best available records from the last several thousand years.
9. Is sea level rising?
 Global mean sea level has been rising at an average rate of 1.7 mm/year (plus or minus 0.5mm) over the past 100 years, which is significantly larger than the rate averaged over the last several thousand years. Depending on which greenhouse gas increase scenario is used (high or low) projected sea-level rise is projected to be anywhere from 0.18 (low greenhouse gas increase) to 0.59 meters for the highest greenhouse gas increase scenario. However, this increase is due mainly to thermal expansion and contributions from melting alpine glaciers, and does not include any potential contributions from melting ice sheets in Greenland or Antarctica. Larger increases cannot be excluded but our current understanding of ice sheet dynamics renders uncertainties too large to be able to assess the likelihood of large-scale melting of these ice sheets.
10. Can the observed changes be explained by natural variability, including changes in solar output?
Since our entire climate system is fundamentally driven by energy from the sun, it stands to reason that if the sun's energy output were to change, then so would the climate. Since the advent of space-borne measurements in the late 1970s, solar output has indeed been shown to vary. With now 28 years of reliable satellite observations there is confirmation of earlier suggestions of an 11 (and 22) year cycle of irradiance related to sunspots but no longer term trend in these data. Based on paleoclimatic (proxy) reconstructions of solar irradiance there is suggestion of a trend of about +0.12 W/m2 since 1750 which is about half of the estimate given in the last IPCC report in 2001. There is though, a great deal of uncertainty in estimates of solar irradiance beyond what can be measured by satellites, and still the contribution of direct solar irradiance forcing is small compared to the greenhouse gas component. However, our understanding of the indirect effects of changes in solar output and feedbacks in the climate system is minimal. There is much need to refine our understanding of key natural forcing mechanisms of the climate, including solar irradiance changes, in order to reduce uncertainty in our projections of future climate change.
In addition to changes in energy from the sun itself, the Earth's position and orientation relative to the sun (our orbit) also varies slightly, thereby bringing us closer and further away from the sun in predictable cycles (called Milankovitch cycles). Variations in these cycles are believed to be the cause of Earth's ice-ages (glacials). Particularly important for the development of glacials is the radiation receipt at high northern latitudes. Diminishing radiation at these latitudes during the summer months would have enabled winter snow and ice cover to persist throughout the year, eventually leading to a permanent snow- or icepack. While Milankovitch cycles have tremendous value as a theory to explain ice-ages and long-term changes in the climate, they are unlikely to have very much impact on the decade-century timescale. Over several centuries, it may be possible to observe the effect of these orbital parameters, however for the prediction of climate change in the 21st century, these changes will be far less important than radiative forcing from greenhouse gases.
11. What about the future?
Due to the enormous complexity of the atmosphere, the most useful tools for gauging future changes are 'climate models'. These are computer-based mathematical models which simulate, in three dimensions, the climate's behavior, its components and their interactions. Climate models are constantly improving based on both our understanding and the increase in computer power, though by definition, a computer model is a simplification and simulation of reality, meaning that it is an approximation of the climate system. The first step in any modeled projection of climate change is to first simulate the present climate and compare it to observations. If the model is considered to do a good job at representing modern climate, then certain parameters can be changed, such as the concentration of greenhouse gases, which helps us understand how the climate would change in response. Projections of future climate change therefore depend on how well the computer climate model simulates the climate and on our understanding of how forcing functions will change in the future.
The IPCC Special Report on Emission Scenarios determines the range of future possible greenhouse gas concentrations (and other forcings) based on considerations such as population growth, economic growth, energy efficiency and a host of other factors. This leads a wide range of possible forcing scenarios, and consequently a wide range of possible future climates.
According to the range of possible forcing scenarios, and taking into account uncertainty in climate model performance, the IPCC projects a best estimate of global temperature increase of 1.8 - 4.0°C with a possible range of 1.1 - 6.4°C by 2100, depending on which emissions scenario is used. However, this global average will integrate widely varying regional responses, such as the likelihood that land areas will warm much faster than ocean temperatures, particularly those land areas in northern high latitudes (and mostly in the cold season). Additionally, it is very likely that heat waves and other hot extremes will increase.

Precipitation is also expected to increase over the 21st century, particularly at northern mid-high latitudes, though the trends may be more variable in the tropics, with much of the increase coming in more frequent heavy rainfall events. However, over mid-continental areas summer-drying is expected due to increased evaporation with increased temperatures, resulting in an increased tendency for drought in those regions.

Snow extent and sea-ice are also projected to decrease further in the northern hemisphere, and glaciers and ice-caps are expected to continue to retreat.